Introduction
In the microscopic world of life, DNA plays a central role. Carrying an organism's genetic information, it acts as a mysterious blueprint for life. However, DNA's form is not fixed, and fragment size is crucial for understanding its morphology.
Determining DNA fragment size has important applications and practical implications across multiple fields. In medicine, detecting fragment abnormalities can be used for early detection of cancer and diagnosis of genetic diseases. For example, abnormalities in the BRCA1/2 gene fragments increase the risk of breast cancer, and excessive CAG repeats in the HTT gene can cause Huntington's disease. In biological evolutionary research, comparing the sizes of homologous fragments across species can infer kinship, and ancient DNA analysis can reveal the genetic characteristics of ancient organisms. In agricultural breeding, fragment sizes associated with desirable traits can be used to rapidly screen target plants. For example, detecting an 8bp deletion in the rice BADH2 gene can identify aromatic rice varieties, improving breeding efficiency and ensuring seed purity.
Principles and Comparison of Main Methods
Agarose Gel Electrophoresis
The classic method is like a "molecular sieve", which uses the difference in the migration rate of DNA in an electric field to separate fragments. By comparing with standards of known size, the size of the DNA fragments in the sample can be determined. It is widely used in fields such as paternity testing.
Capillary Electrophoresis
It is more efficient and accurate, using capillaries as separation channels. Under the action of high electric fields, it can quickly separate DNA fragments and even distinguish fragments with very small length differences, which plays a significant role in forensic identification.
Sequencing Technology
Starting from the base sequence level, the fragment size is determined by measuring the number of bases. High-throughput sequencing can process massive fragments at the same time, providing powerful support for genome research.
Capillary Electrophoresis Has Advantages in Determining DNA Fragment Size
It is more efficient, completing separation in just a few minutes, much faster than agarose gel electrophoresis, making it ideal for rapid screening of large-scale samples. It also has extremely high resolution, capable of accurately identifying fragments that differ by only a few base pairs, achieving single-base-pair resolution, providing precise evidence for fields such as forensic identification.
At the same time, it has a high degree of automation and is operated entirely by instruments, which reduces human errors and can process samples in batches, greatly improving work efficiency. Moreover, it requires few samples and is suitable for trace samples with its high sensitivity, broadening its application in scenarios such as paleontological DNA research and clinical trace pathology analysis.
Compared with sequencing technology, although capillary electrophoresis cannot obtain base sequences, it is more efficient and economical in detecting and typing fragments of known sizes, and is the preferred technology for quickly determining differences in known fragments.
GeneCE-100 Performance Verification
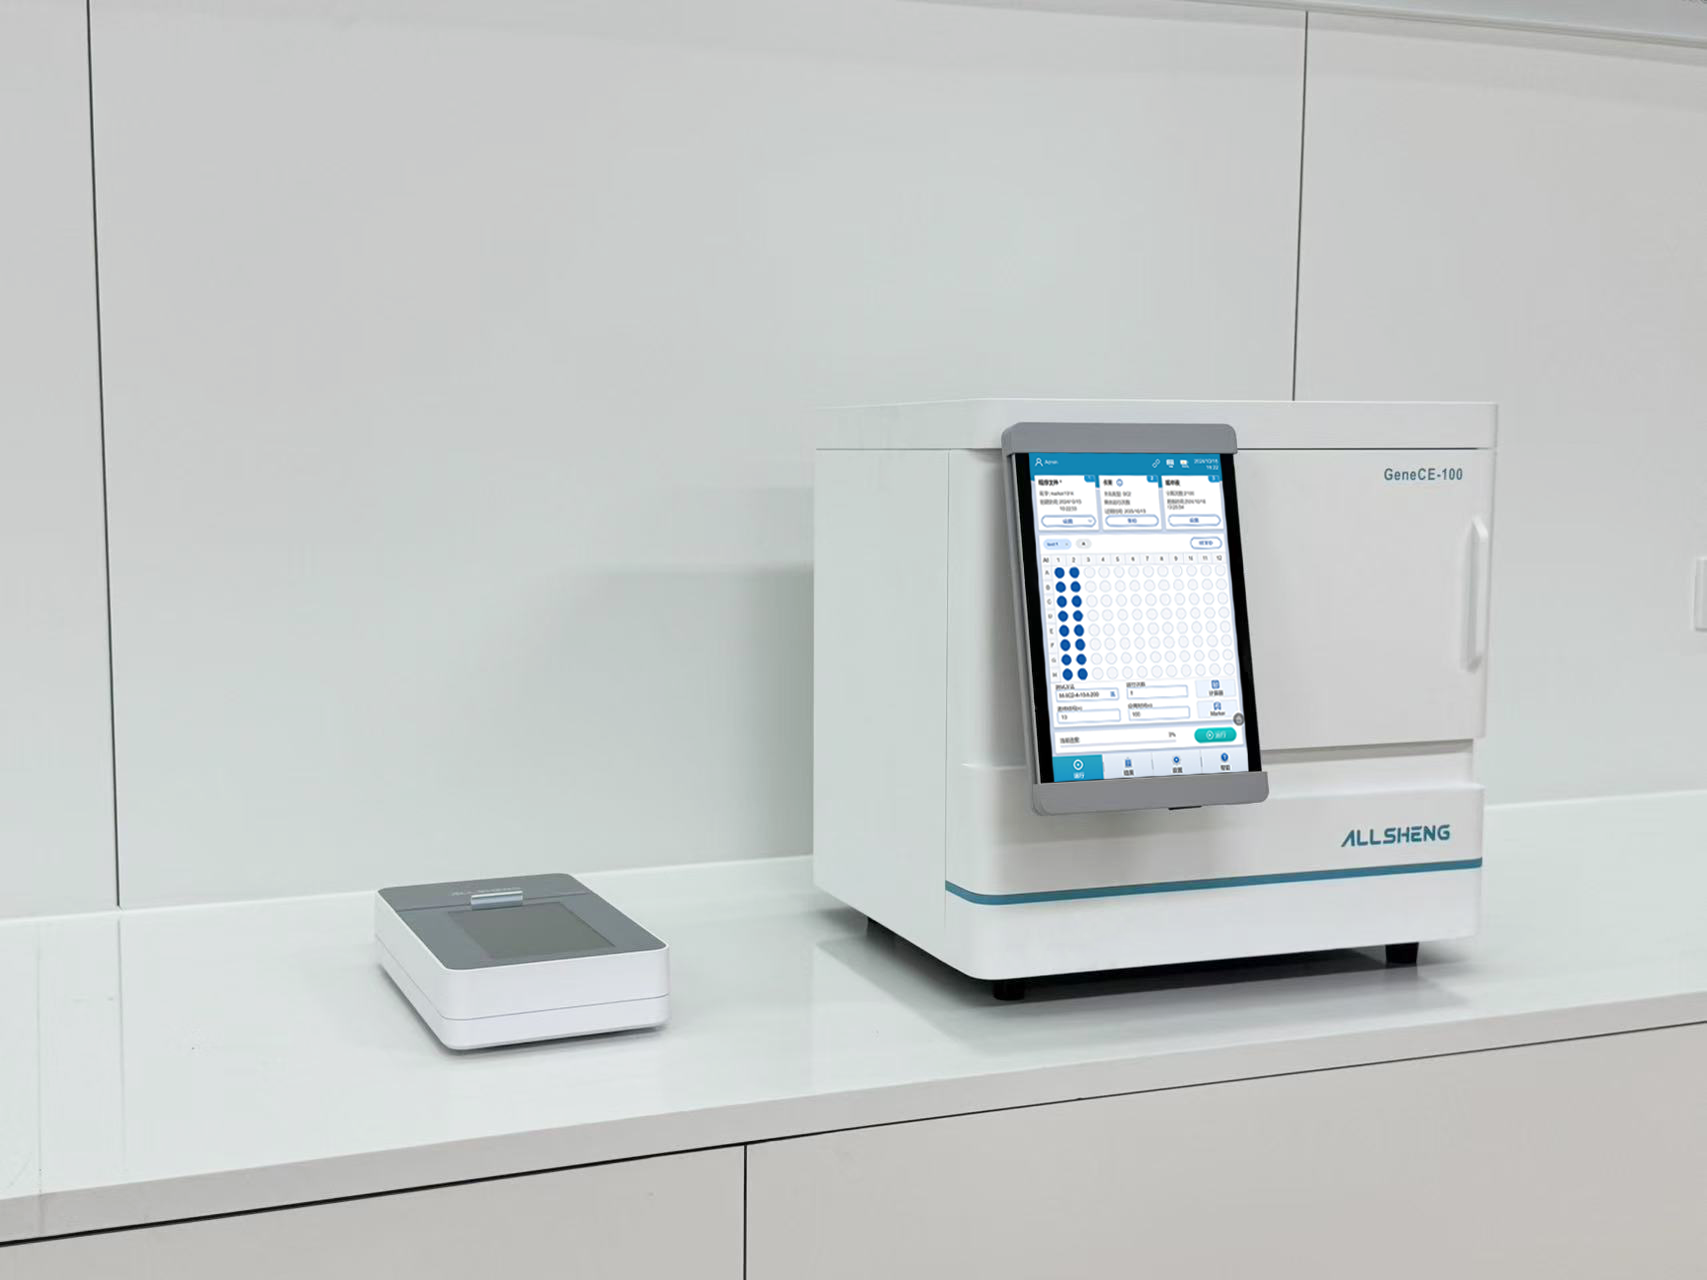
Allsheng GeneCE-100 biofragment analysis system is designed for quantitative and qualitative analysis of DNA and RNA samples. The automated electrophoresis system can run 1-104 samples simultaneously. The operation of instrument are simple, no manual gel preparation required, and can achieve fully automatic sample detection.
Widely used in experiments such as gDNA quality control, NGS library quality control, cfDNA quality control, PCR product detection, total RNA and fragmented RNA sample quality control, etc.
Click to learn more details
Experimental Design
To verify the performance of GeneCE-100 for DNA fragment size detection, we ran experiments on circular samples, linear samples, and mixed circular & linear samples to see if we could distinguish the morphology of DNA.
Circular Sample Testing
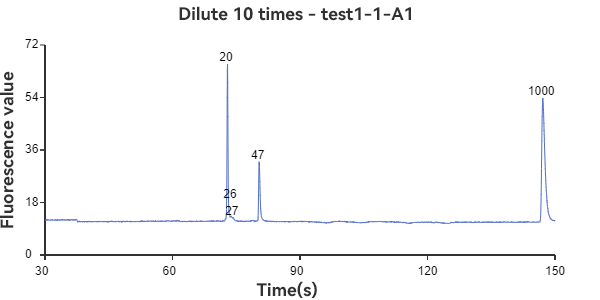
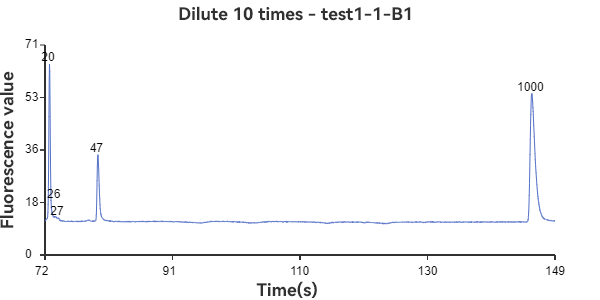
A1 and B1 are circular samples
Linear Sample Testing
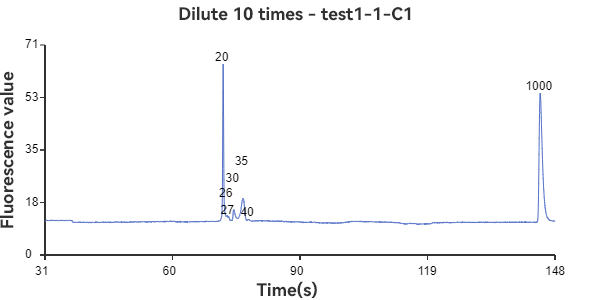
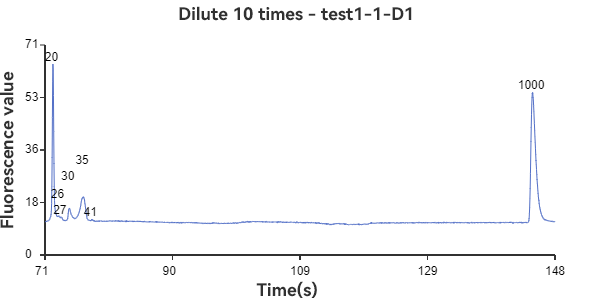
C1, D1 are linear samples
Mixed Circular & Linear Sample Testing
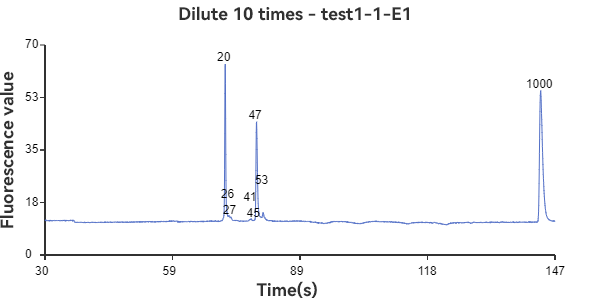
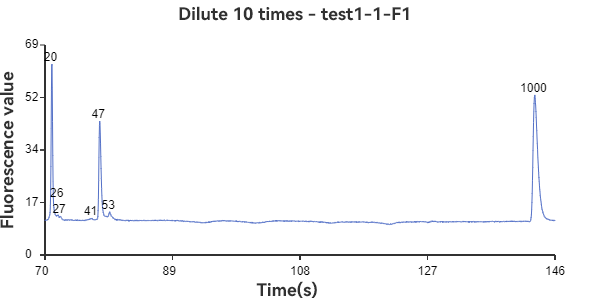
E1 and F1 are mixed circular & linear samples
Experimental Summary
The experimental results show that the circular sample has a stable peak at 47bp, the linear sample has a smaller peak around 35bp, and the mixed sample has a large peak at 47bp plus surrounding smaller peaks. The circular sample appears as a relatively independent single peak in the peak plot, reflecting the stability of the circular DNA structure and the fixed nature of the single fragment. While the linear sample, while theoretically the same length as the circular fragment, has varying degrees of folding, representing a folded secondary structure, it appears as a more dispersed peak within a range of lengths. The three samples can be easily distinguished through the peak plot, demonstrating the superior performance of GeneCE-100 in fragment analysis.

 Biological Sample Preparation
 Life Science Detection Products
 POCT Detection & Reagent
 Automation & Liquid Handling
 Laboratory Instrument
 Reagent & Consumable
 Others
 OEM/ODM


 Release time:2025-08-20
 Source:
 Pageviews:632


 + 86 571-88859758
 sales@allsheng.com


