The library quality is crucial for the data quality produced by high-throughput NGS, and underestimating or overestimating the library quality can seriously affect the effectiveness of sequencing. At present, the most commonly used quantitative reagent is a fluorescent dye with Picogreen as the main component. It can only emit fluorescence when it binds to DNA double strands, and the generated fluorescence is proportional to DNA concentration within a certain range, thus playing a precise quantitative role in DNA samples.
The most common instruments used with such reagents are fluorometers and fluorescence microplate readers. Common fluorometers include Thermo Qubit4 and Qubit Flex, as well as Allsheng's own products Fluo-200 and Fluo-800. However, the throughput of fluorometers is limited, and they can only reach up to 8 channels. To perform 8-channel sample detection simultaneously, standard calibration for 8 channels is also required, which is a waste of reagents. When using a fluorescence microplate reader as a detection tool, although the detection throughput has increased, there is a problem of establishing a standard curve. Due to the significant influence of the environment on fluorescent dyes, a new standard curve needs to be established for each sample detection. If the curve performance is not ideal, a new standard curve needs to be prepared to increase the experimental burden.

Allsheng Feyond-F100 fluorescence microplate reader can not only perform common fluorescence experiments such as cell activity, GFP, RFP, ORAC, Ca2+flow analysis, etc., but also has a new quantitative detection function that combines the convenience of the fluorometer with the high-throughput of the microplate reader. There is no need to establish a standard curve, and only calibration of the standard points is required to achieve precise quantification of 96 samples, with a minimum detection limit of 0.1ng/μL (10μL sample).
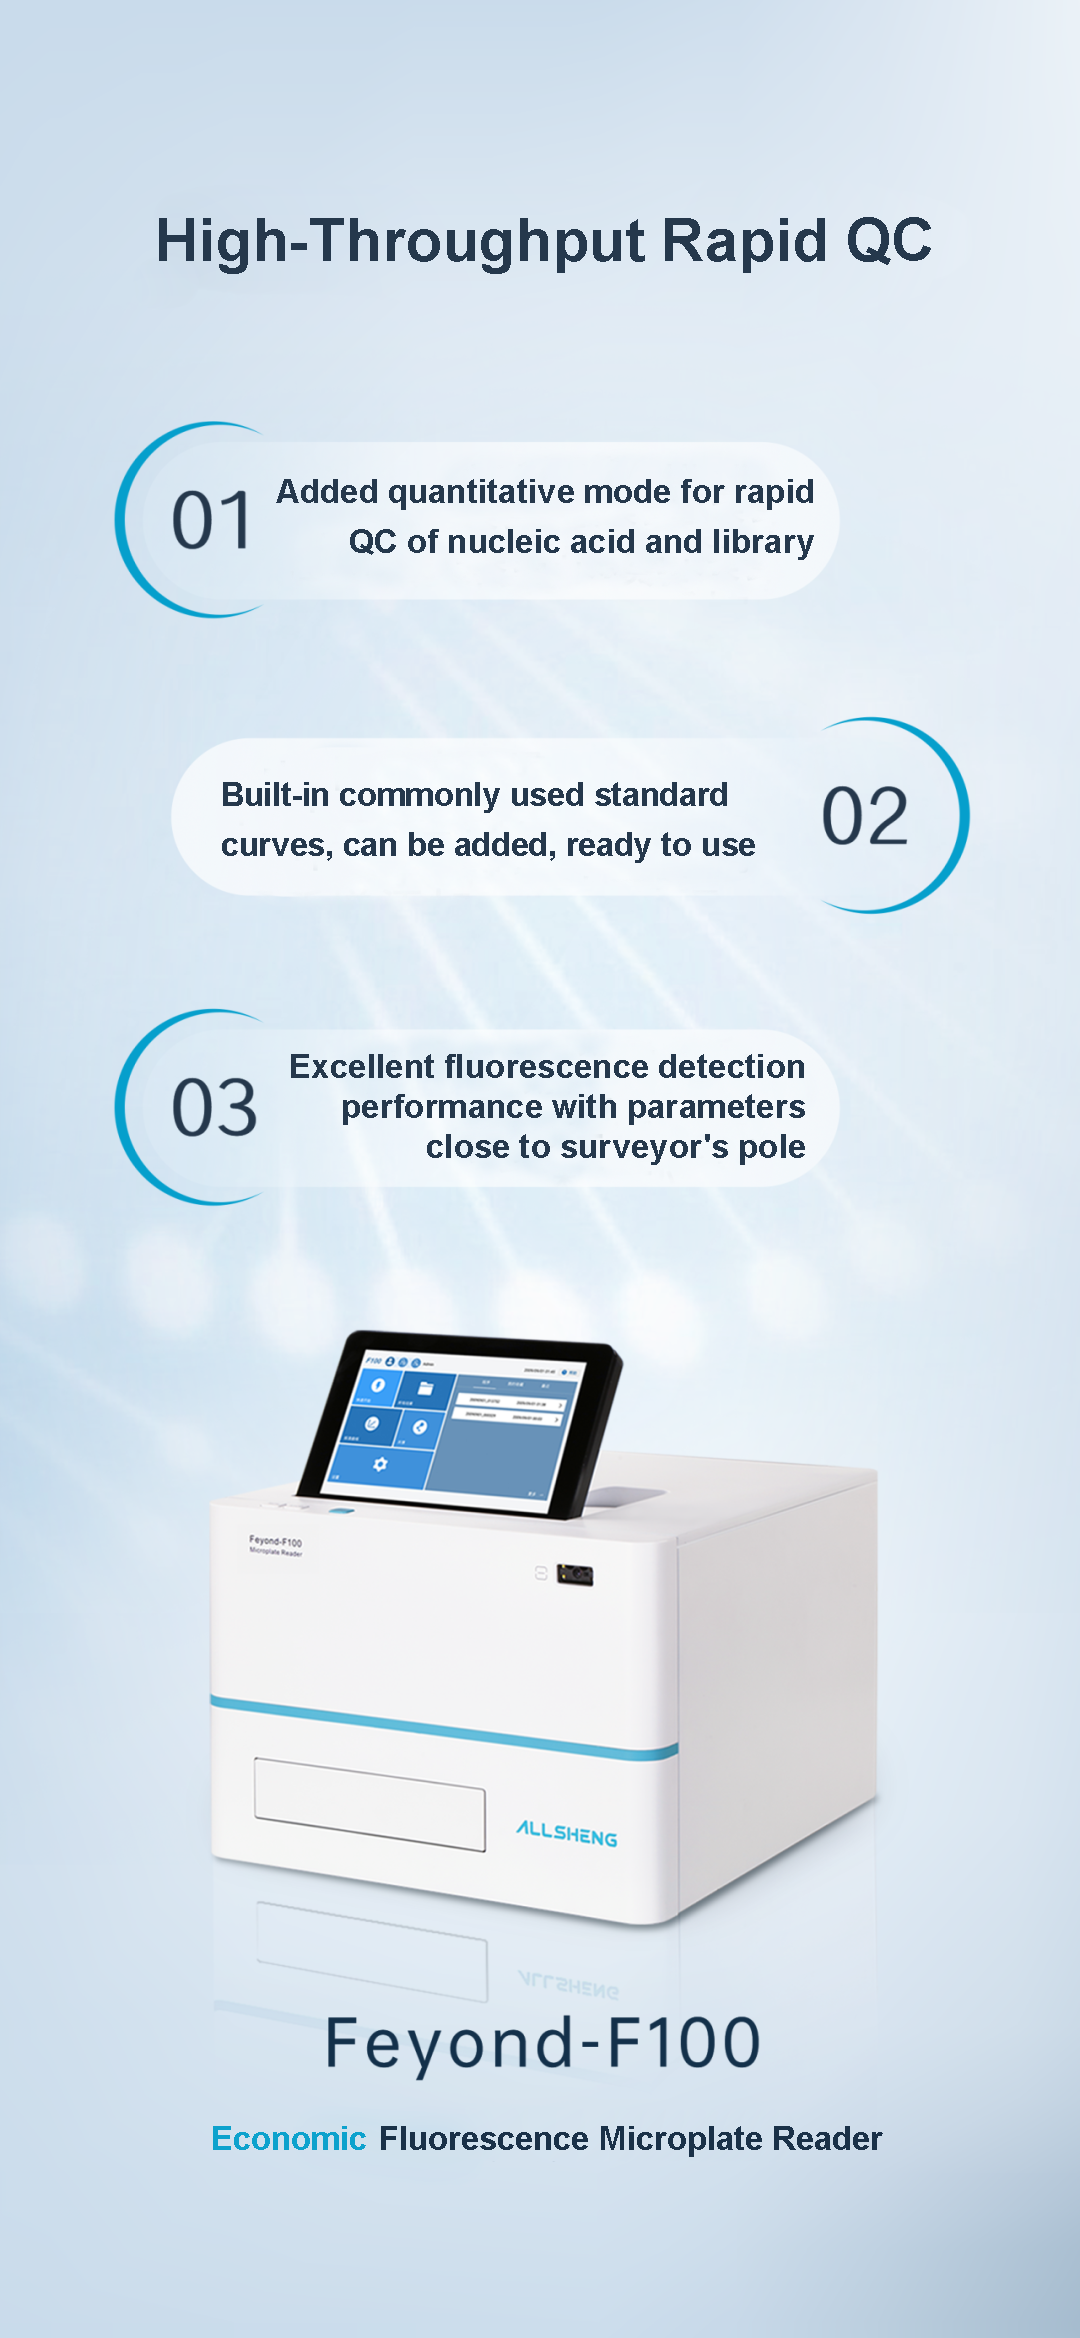
Special Features
●Besides conventional fluorescence detection, a new quantitative mode has been added
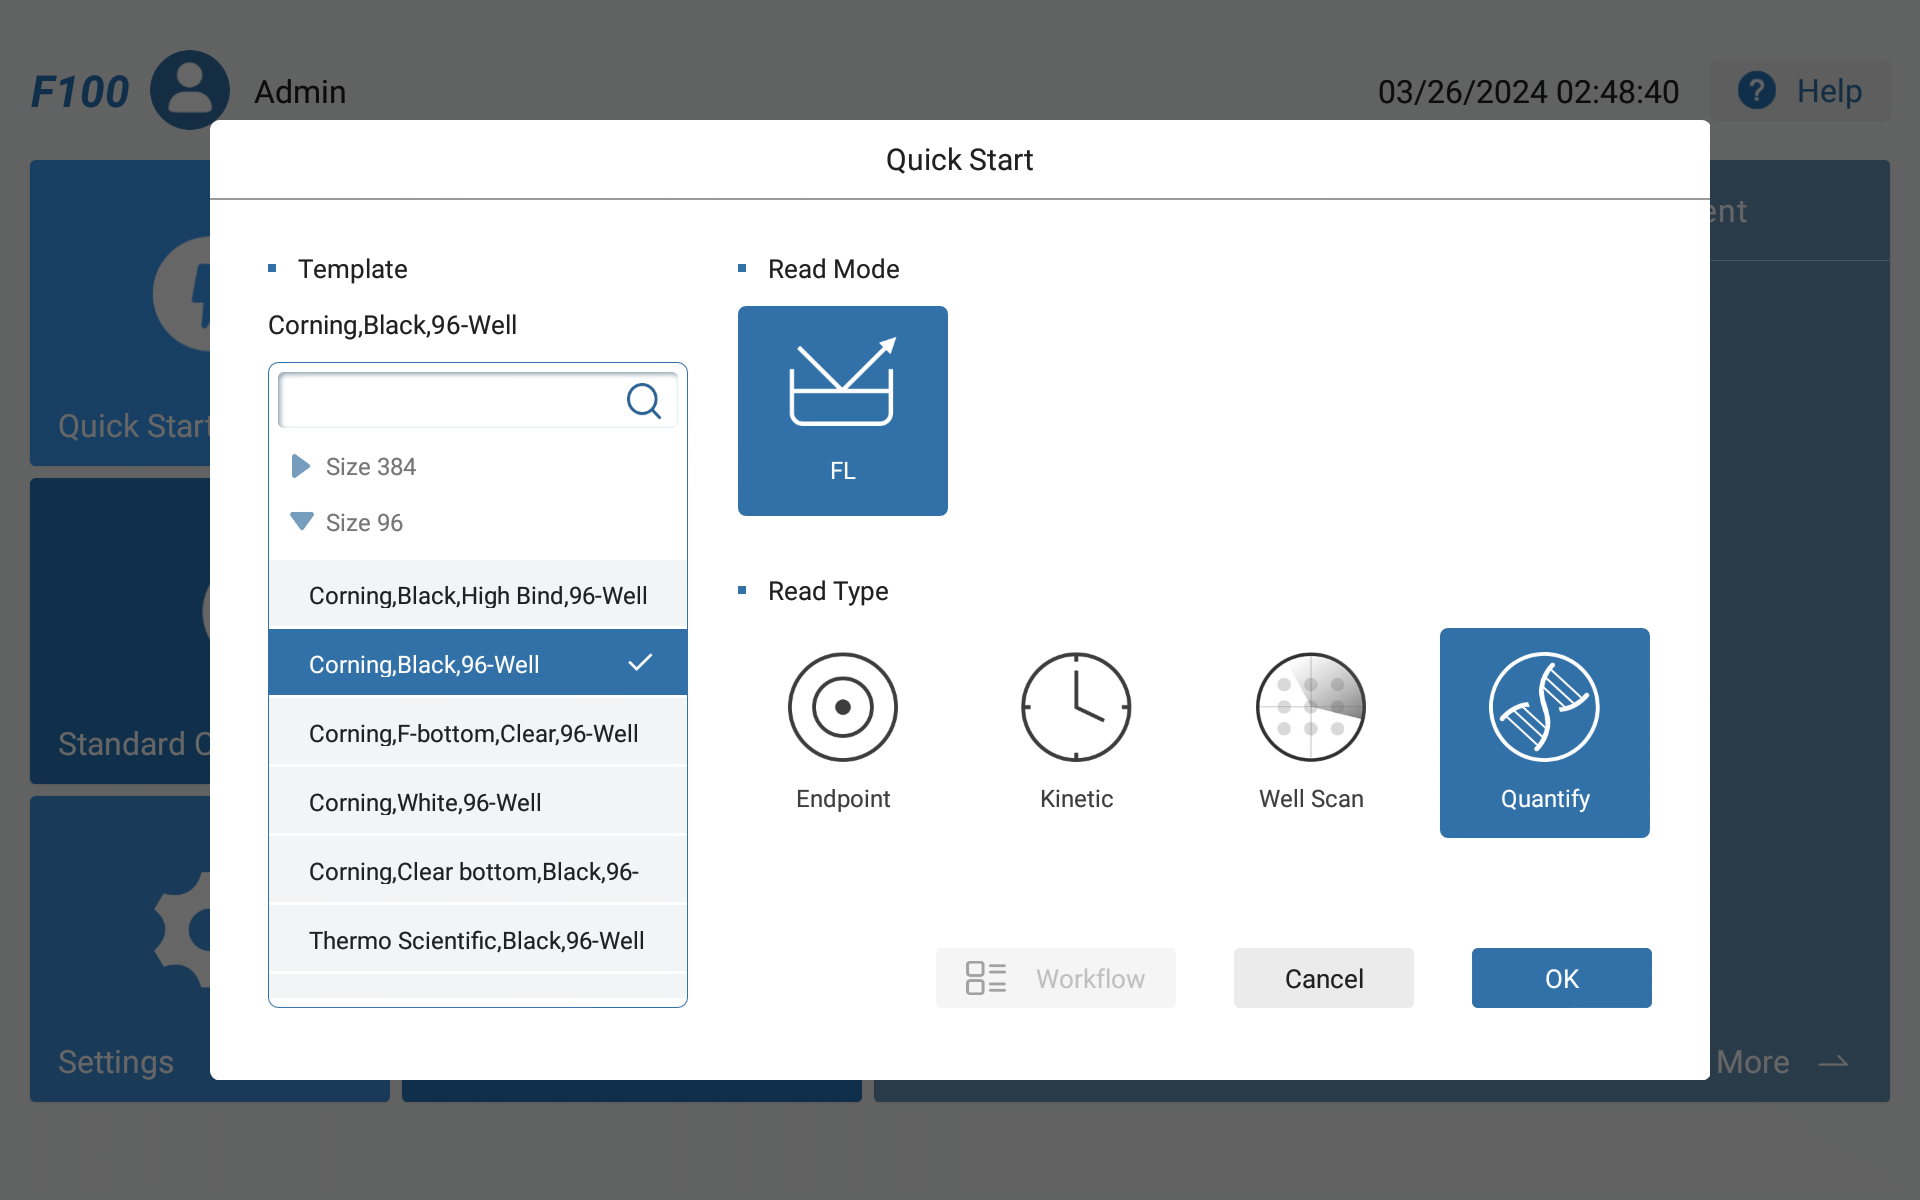
Figure 1 Feyond-F100 Main Interface
●Simply lay out two standard points to complete curve calibration
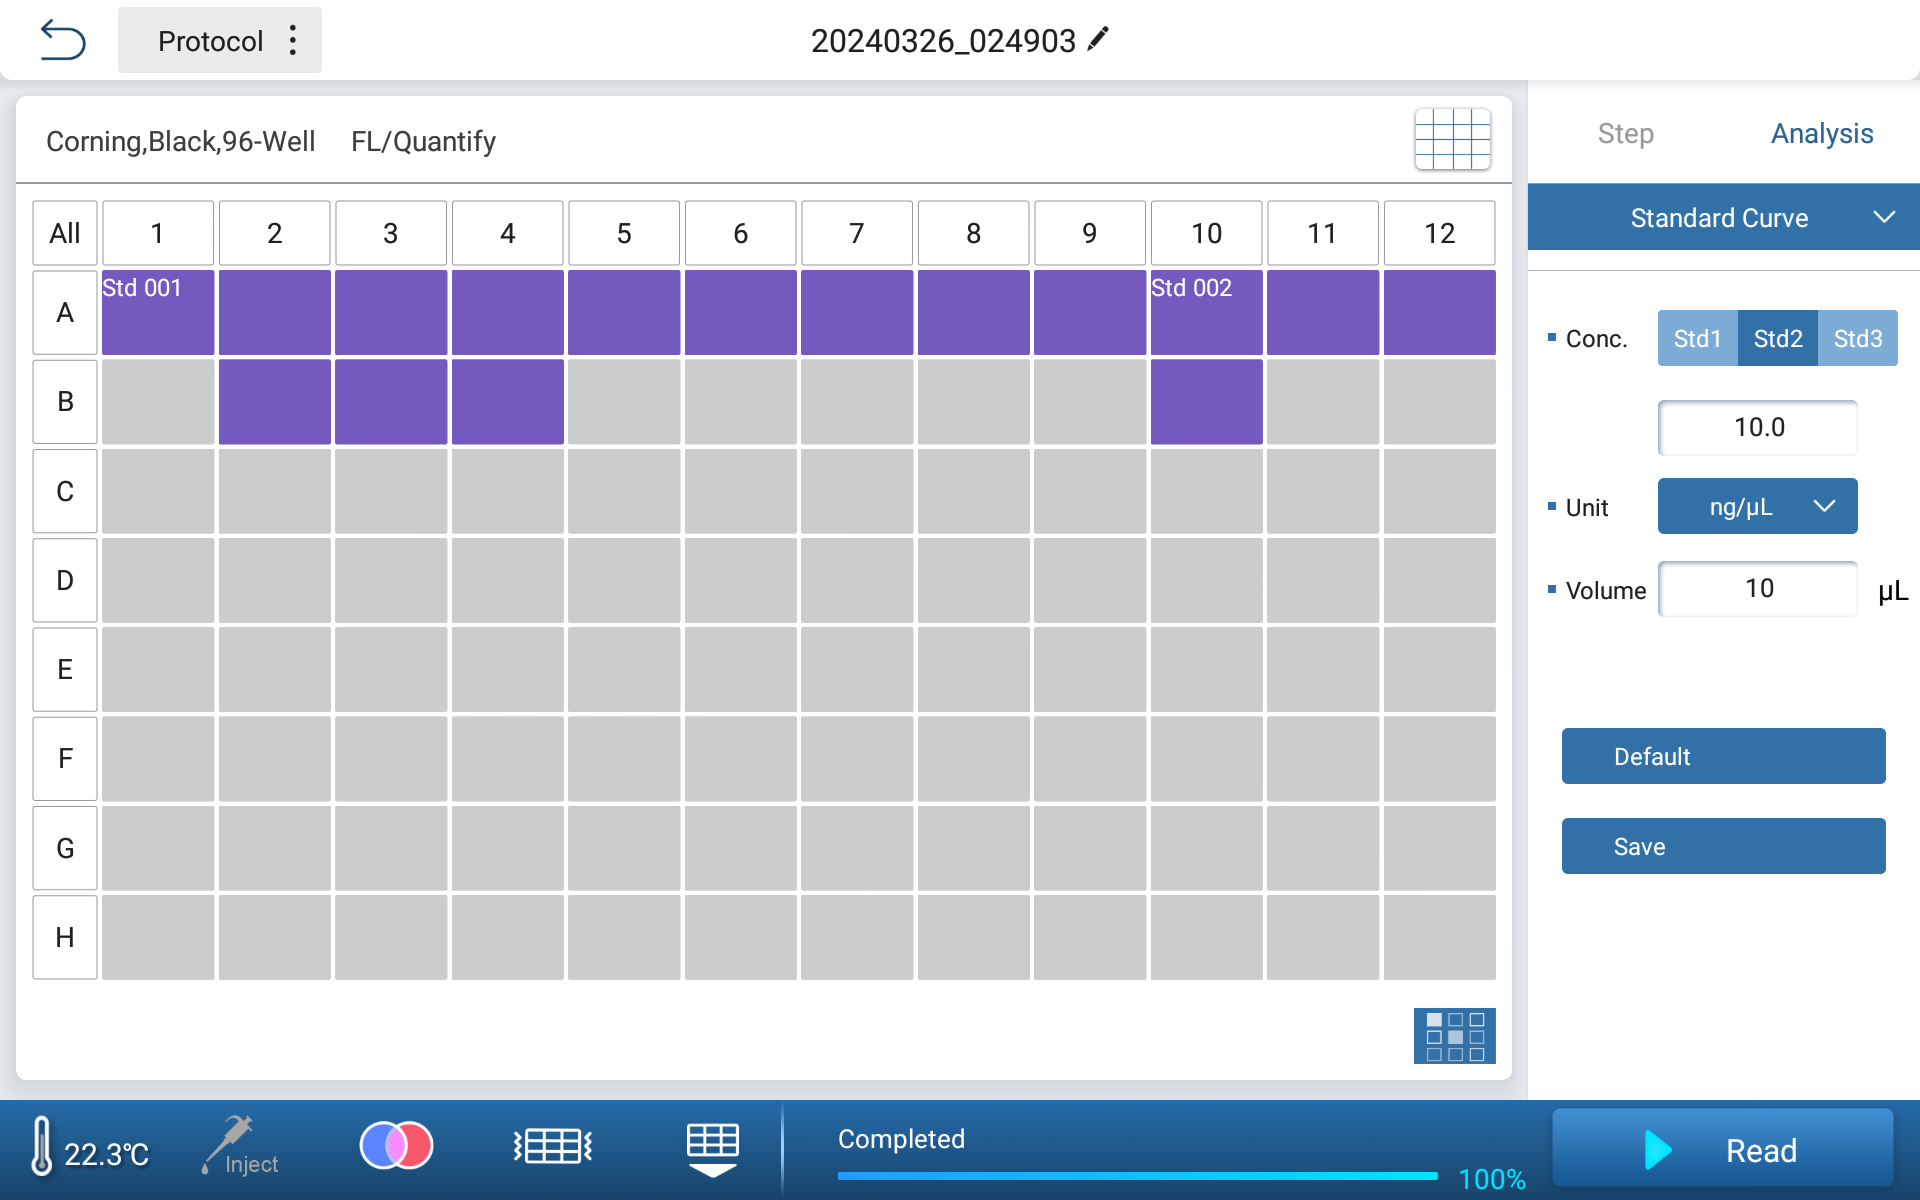
Figure 2 Standard Calibration Interface
●Built-in standard curves, simply calling up, also can create curves to save
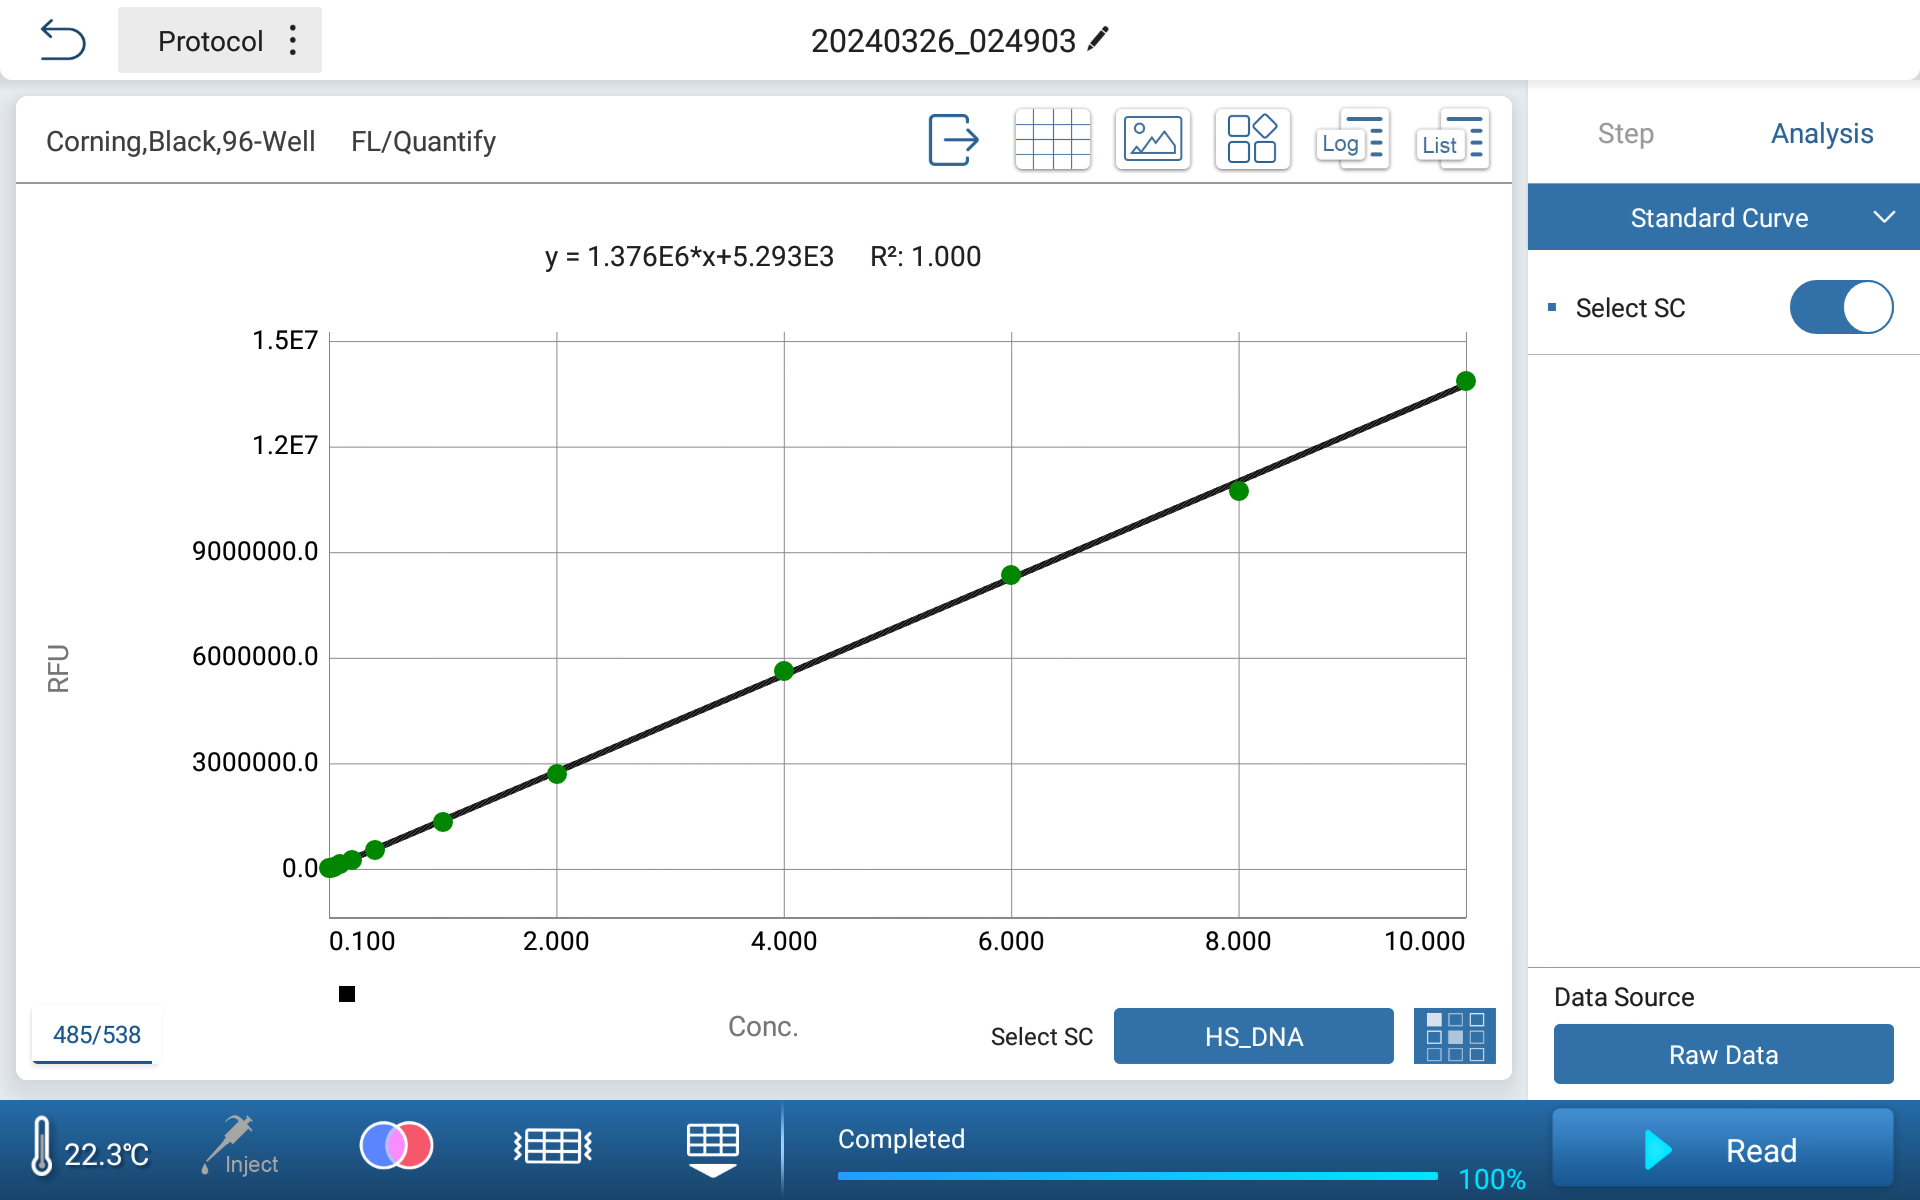
Figure 3 Standard Curve Interface
●Simply enter the sample volume and see the results at a glance
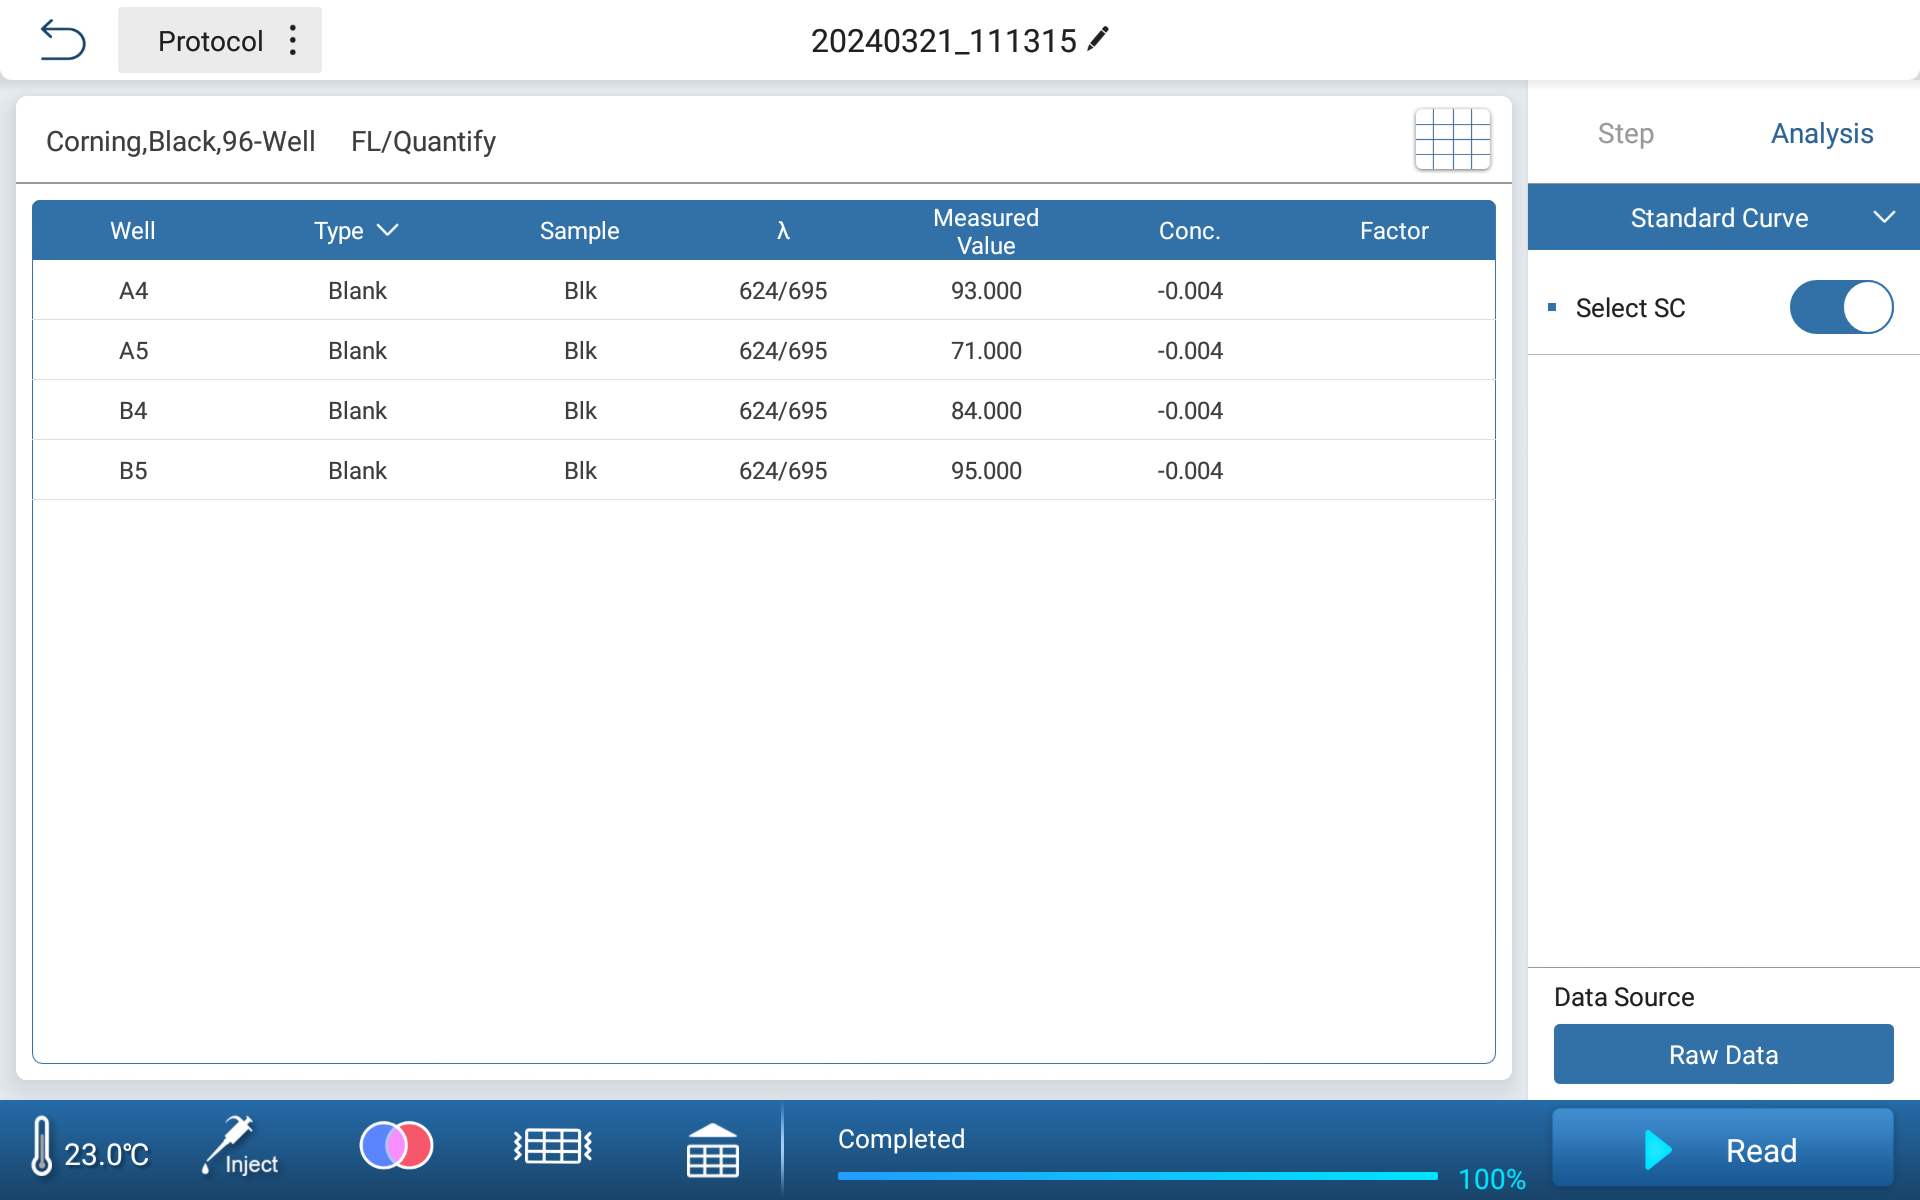
Figure 4 Result Display Interface
Excellent Performance
●Performance Verification of Standard Products
Dilute the 10ng/μL standard gradient to 8, 6, 4, 2, 1, 0.4, and 0.2ng/μL. When the sample capacity is 1μL or 10μL, the deviation between Feyond-F100 and Q is within 10%.
Table 1 Standard Testing Results
Volume | Sample type | Q quantitation | Feyond- F100 | Difference | Deviation |
10 | Standard | 0.189 | 0.1941 | -0.0051 | -2.7% |
10 | Standard | 0.378 | 0.3854 | -0.0074 | -2.0% |
10 | Standard | 0.982 | 0.9739 | 0.0081 | 0.8% |
10 | Standard | 1.93 | 1.9675 | -0.0375 | -1.9% |
10 | Standard | 4 | 4.0883 | -0.0883 | -2.2% |
10 | Standard | 5.94 | 6.0796 | -0.1396 | -2.4% |
10 | Standard | 7.78 | 7.8077 | -0.0277 | -0.4% |
10 | Standard | 10.2 | 10.0803 | 0.1197 | 1.2% |
1 | Standard | 1.03 | 1.095 | -0.065 | -6.3% |
1 | Standard | 1.92 | 1.997 | -0.077 | -4.0% |
1 | Standard | 4.1 | 4.12 | -0.02 | -0.5% |
1 | Standard | 6.18 | 6.043 | 0.137 | 2.2% |
1 | Standard | 8.14 | 7.895 | 0.245 | 3.0% |
1 | Standard | 10.5 | 10.059 | 0.441 | 4.2% |
●Library and Nucleic Acid Quantitation
When testing library samples and cfDNA samples, the deviation between Feyond-F100 and Q can also be within 10%.
Table 2 Sample Testing Results
Volume | Sample type | Q quantitation | Feyond- F100 | Difference | Deviation |
1 | Library | 104 | 105.079 | -1.079 | -1.0% |
1 | Library | 74.2 | 74.102 | 0.098 | 0.1% |
1 | Library | 77.4 | 75.628 | 1.772 | 2.3% |
1 | Library | 22.6 | 22.245 | 0.355 | 1.6% |
1 | Library | Out of range | 148.53 | / | / |
1 | Library | 52.4 | 53.455 | -1.055 | -2.0% |
1 | Library | 84.6 | 87.402 | -2.802 | -3.3% |
1 | Library | 11.5 | 10.8 | 0.7 | 6.1% |
2 | cfDNA | 0.456 | 0.482 | -0.026 | -5.7% |
2 | cfDNA | 1.27 | 1.287 | -0.017 | -1.3% |
2 | cfDNA | 0.625 | 0.622 | 0.003 | 0.5% |
2 | cfDNA | 0.758 | 0.794 | -0.036 | -4.7% |
2 | cfDNA | 1.45 | 1.522 | -0.072 | -5.0% |
2 | cfDNA | 1.48 | 1.542 | -0.062 | -4.2% |
Note: The above experimental data is sourced from Allsheng laboratory

 Biological Sample Preparation
 Life Science Detection Products
 POCT Detection & Reagent
 Automation & Liquid Handling
 Laboratory Instrument
 Reagent & Consumable
 Others
 OEM/ODM


 Release time:2024-03-26
 Source:
 Pageviews:2223


 + 86 571-88859758
 sales@allsheng.com


