Transcreener Fluorescence Polarization Assay Performed on Feyond-A500 Multi-Mode Microplate Reader
Transcreener technology is a universal high-throughput biochemical detection platform based on nucleotide detection. This assay is based on the detection of ADP/GDP, which can be catalyzed by thousands of kinases, many of which catalyze covalent regulatory reactions that are at the core of cell signaling and have important value in drug discovery.
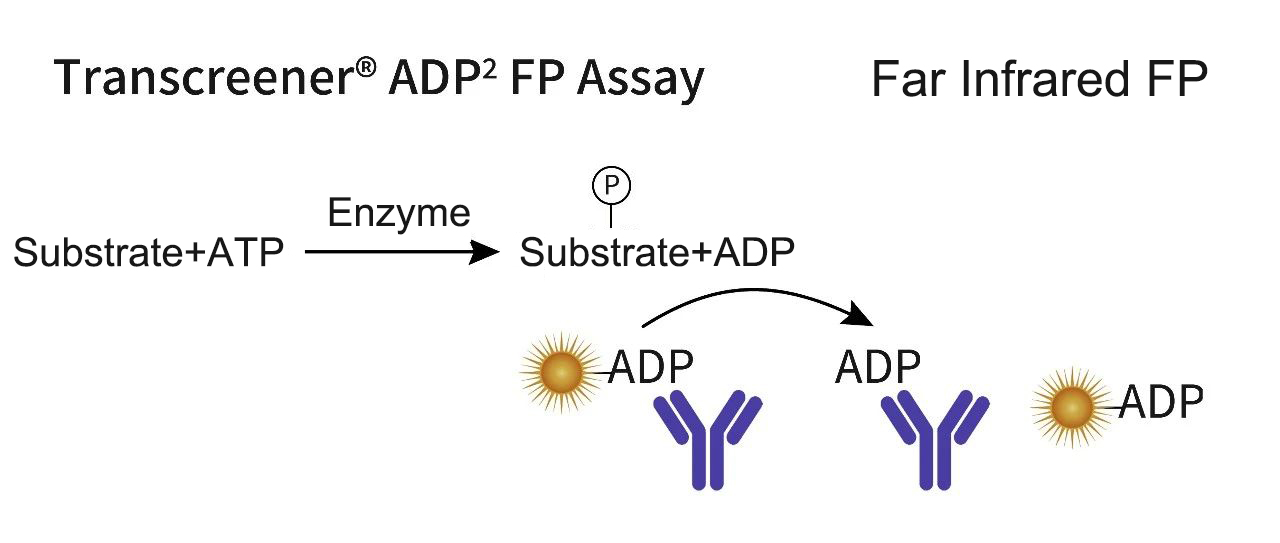
Principle
All tested reagents are far-infrared tracers that bind to highly specific monoclonal/polyclonal antibodies. Enzyme reactions produce diphosphate nucleotides or monophosphate nucleotides, which replace the tracer in the antibody-quencher conjugate. Due to the increased rotational freedom of the tracer, polarization decreases.
Verification Standard
Prepare a 10 μM ATP/ADP standard curve to simulate enzyme reactions. Starting from 10 μM ATP, the addition of ADP increases, ATP decreases proportionally, and the total adenylic acid concentration remains at 10 μM. When the conversion rate of 10 μM ATP is 10%, Z'>0.7 and ΔmP>120 are required.
Material and Method
·Feyond-A500 multi-mode microplate reader (ALLSHENG)
·Transcreener® ADP2 FP Assay (Code: 3010-1K)
·ATP/ADP mixture in buffer solution (constant adenine concentration 10 μM)
·Corning all black microplate 96-well fluorescence detection plate (Code: 3915)
Table 1 ADP/ATP Standard Curve Preparation (10 μM Mother Liquid)
% Concentration | ATP | ADP |
100 | 0 | 100 |
75 | 25 | 75 |
50 | 50 | 50 |
25 | 75 | 25 |
15 | 85 | 15 |
10 | 90 | 10 |
7.5 | 92.5 | 7.5 |
5 | 95 | 5 |
3 | 97 | 3 |
2 | 98 | 2 |
1 | 99 | 1 |
0 | 100 | 0 |
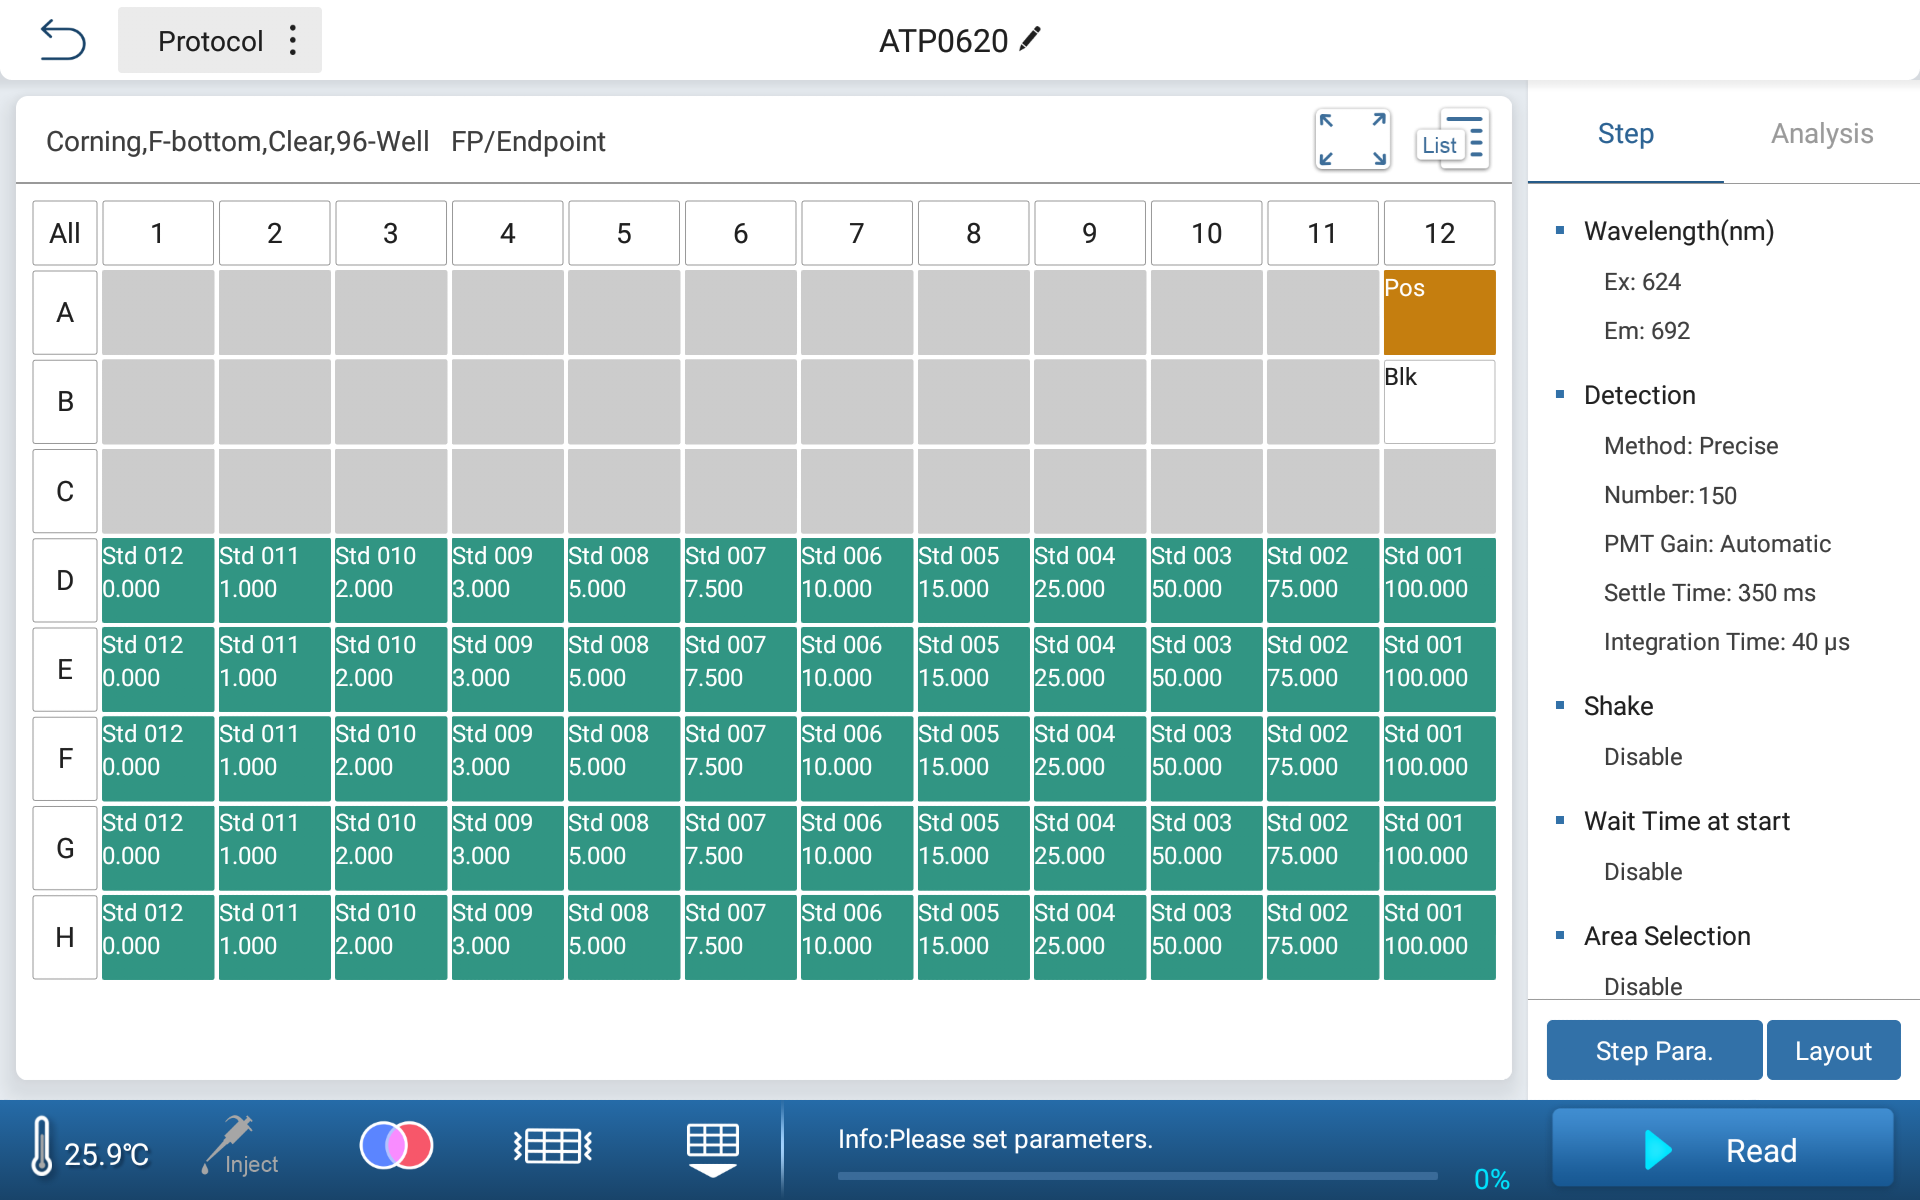
Table 2 Instrument Parameter Settings
Mode | FP |
Excitation Wavelength (EX) | 624-40 nm |
Emission Wavelength (EM) | 692-40 nm |
G-factor | 1.06 |
Number | 150 |
Gain | Automatic |
Integration Time | 40 μs |
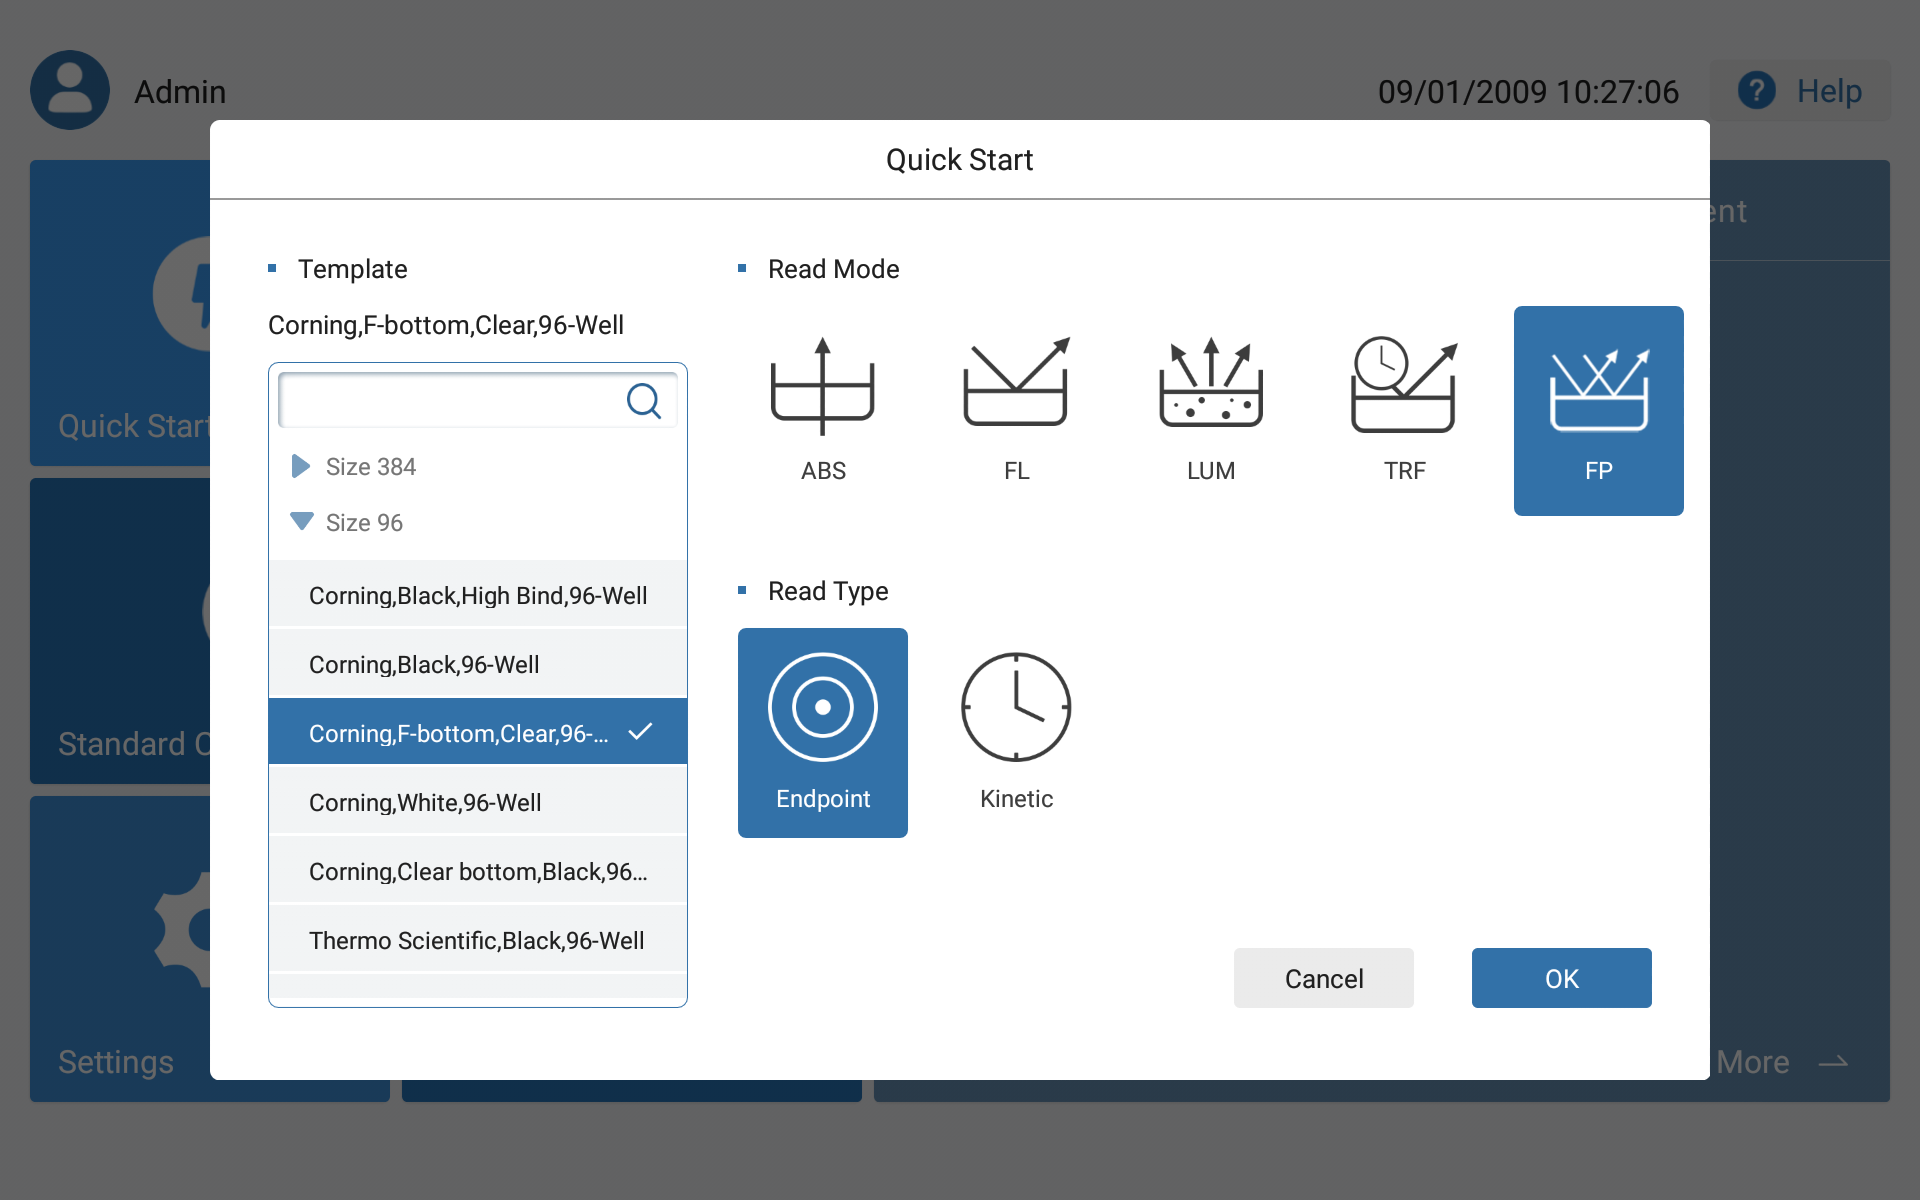
1. FP Read Mode Selection
2. Instrument Parameter Settings
Result
As the ADP:ATP ratio increases, the ratio of bound tracer to free tracer decreases, resulting in an overall decrease in mP value. Read the standard points on Feyond-A500 microplate reader.
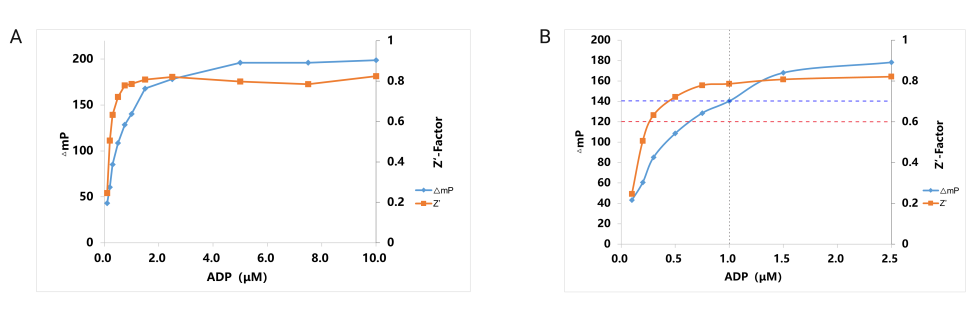
A: The observed values of Z' and ΔmP in the standard curve simulating the conversion of 10 μM ATP to ADP.
B: The magnified image of the standard curve 0-2.5 μM ADP section shows the minimum qualified data for Z' validation (blue dashed line) and the minimum qualified data for ΔmP validation (red dashed line). 10% ATP conversion verification point (vertical black dashed line).
Conclusion
Feyond-A500 multi-mode microplate reader passed the validation criteria for the Transcreener ADP2 FP assay. The filter-based measurement result of Z ' value is 0.79 (standard: Z' value>0.70 at 10% conversion rate with 10 μM ATP), and the measurement result of ΔmP is 140 (standard: ΔmP>120 mP at 10% conversion rate with 10 μM ATP).

 Biological Sample Preparation
 Life Science Detection Products
 POCT Detection & Reagent
 Automation & Liquid Handling
 Laboratory Instrument
 Reagent & Consumable
 Others
 OEM/ODM


 Release time:2024-09-11
 Source:
 Pageviews:1581


 + 86 571-88859758
 sales@allsheng.com


